
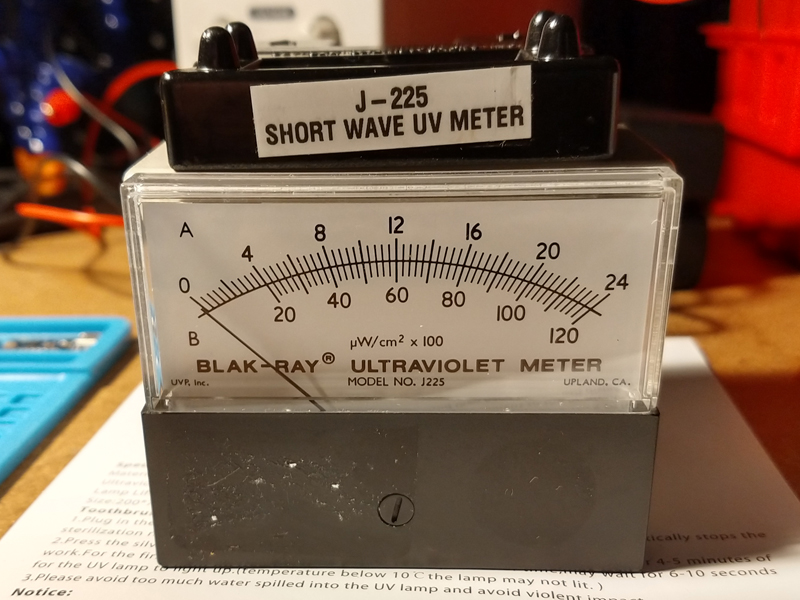
A way to measure the UV-C energy was needed calibrated to the correct wavelengths. I have used Ophir Starlite digital power meters in industry in the past with Lasers and LEDs for wavelengths in and around this range, but they are prohibitively expensive. Luckily I came across the BLAK-RAY J-225 Short Wave UV meter which specifically meant for measuring UV-C bulb power output (pic above). Its measurement sensitivity range is from 220nm-290nm with peak sensitivity at 254nm, which is just what I need. You can find lots of these units used on eBay. I was able to find one in great shape with a relatively recent calibration for only $40!
It is a neat little analog device, and seems to be self-powered. The measurement probe is on top of the unit and has a rectangular area that collects the UV-C light. This probe is actually removable and can be connected with simple banana jack cables for remote use in smaller areas. Output is measured in micro Watts per square centimeter. There is a switch on top of the unit to switch between the A (top) and B (bottom) measurement ranges on the analog meter.
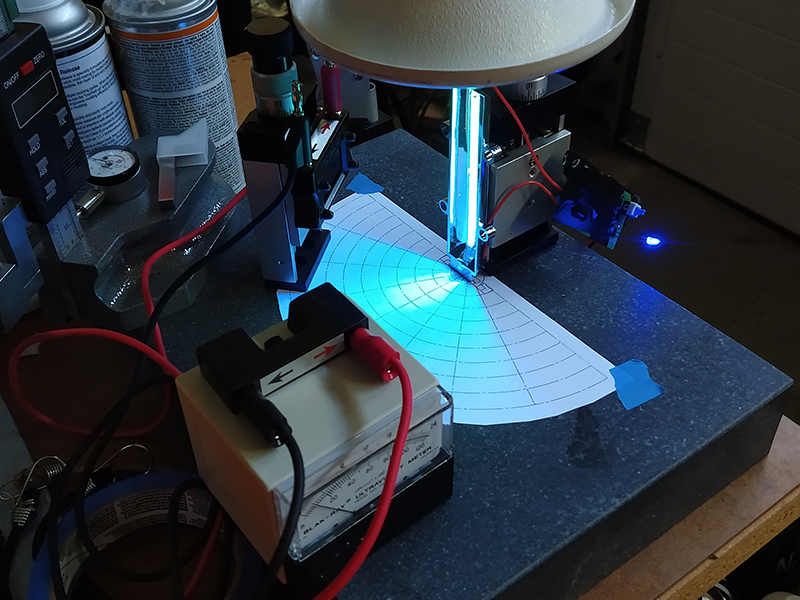
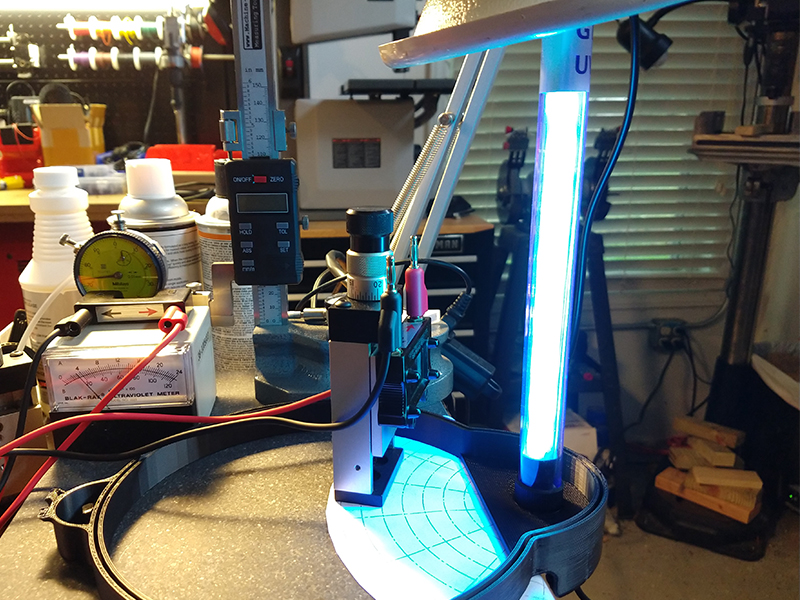
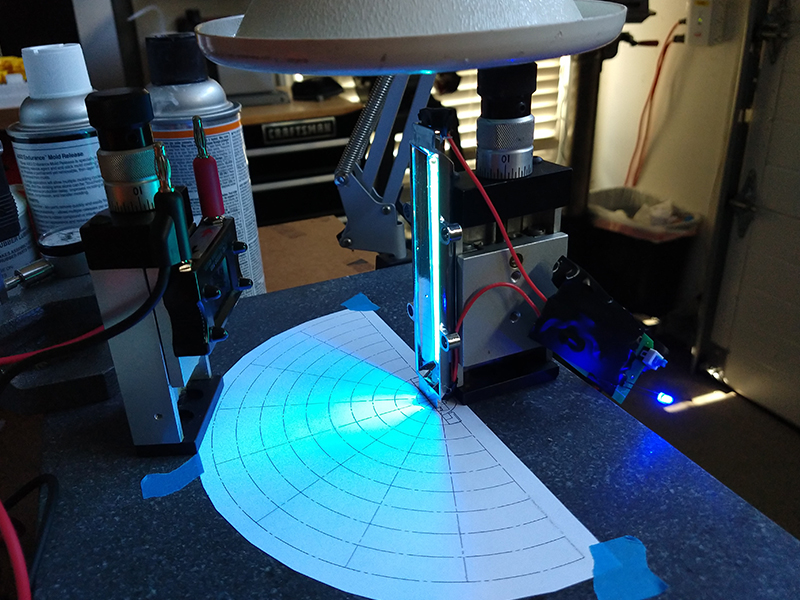
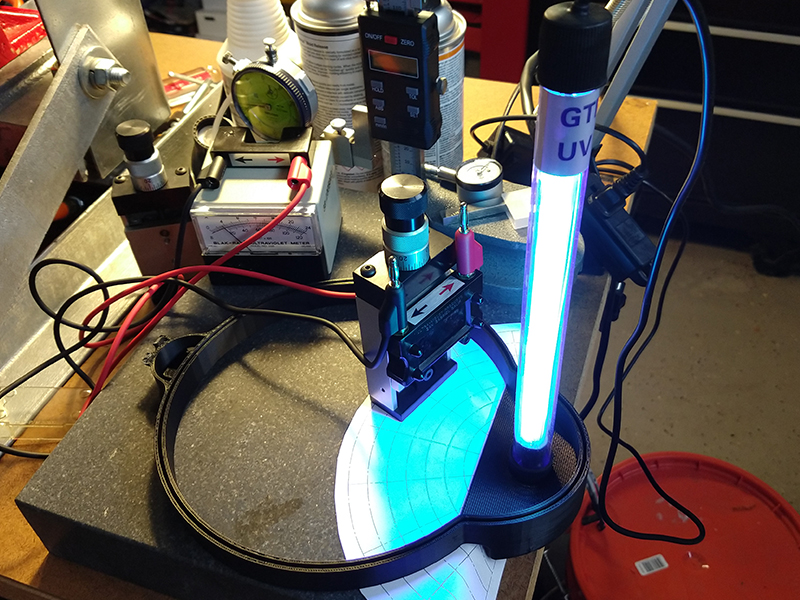
To make a contour plot of the energy emitted from the bulbs, I made a semi-circle pattern and printed it out with 22.5 degree radials with 10mm spacing along each up to 100mm. I placed this pattern on my little flat granite block measuring surface plate and put the bulb at the center as shown in the images above. I mounted the UV-C probe onto a small linear translation slide so I could adjust the Z height if needed. I then moved the probe to the 90 points and manually recorded them in excel.
The 90 data points were laid out in a table at their respective X and Y coordinates. Unfortunately when making contour plots in Excel, it cannot automatically fill-in/interpolate data between X/Y points, so the plot does not really work. So I turned to the really awesome python program, Plotly. With a lot of massaging of the data first in Excel and Notepad++, I was able to modify one of their online contour plot demos with my data to produce the really nice plots below. Also Plotly lets you save plots as vector SVG file format, which helps a lot to make 3D CAD model of the out energy; more on that further down.
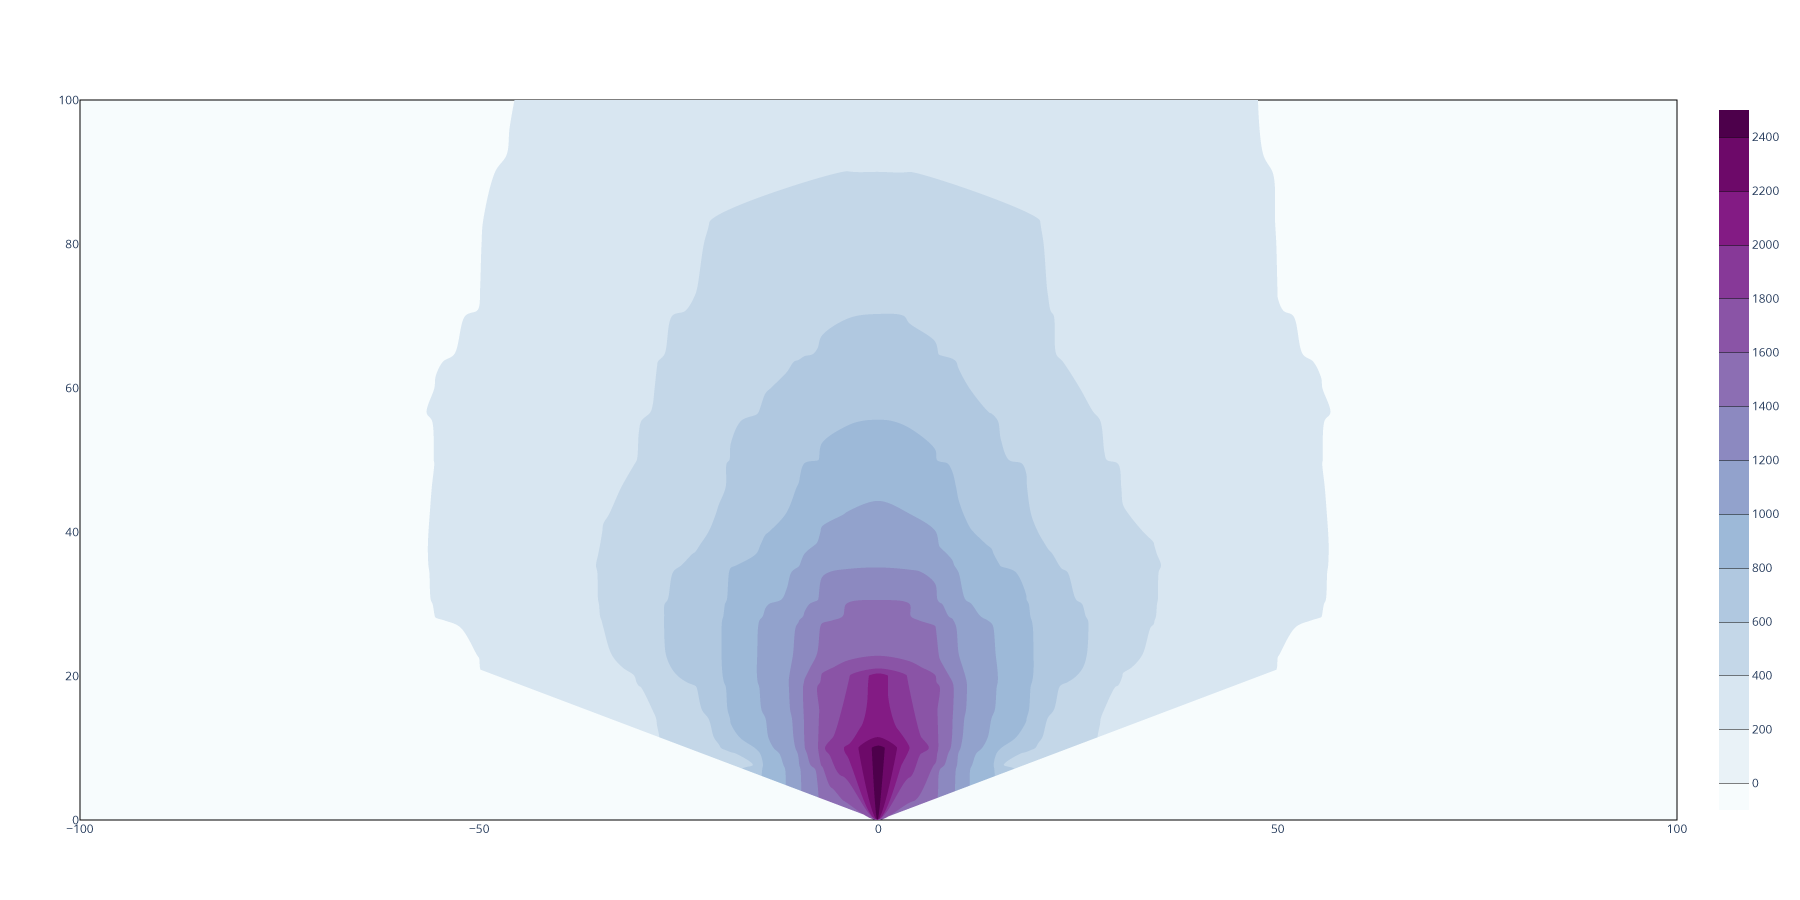
Above is the contour plot of the Toothbrush bulb with reflector. The X and Y axes are position distance in mm, intensity scale on right side is μW/cm^2. I cleaned up the reflector path since light will be blocked directly to the right and left of the bulb. There is approximately a 12.5% drop off in power between the mid plane Z-height of the bulb and the ends.
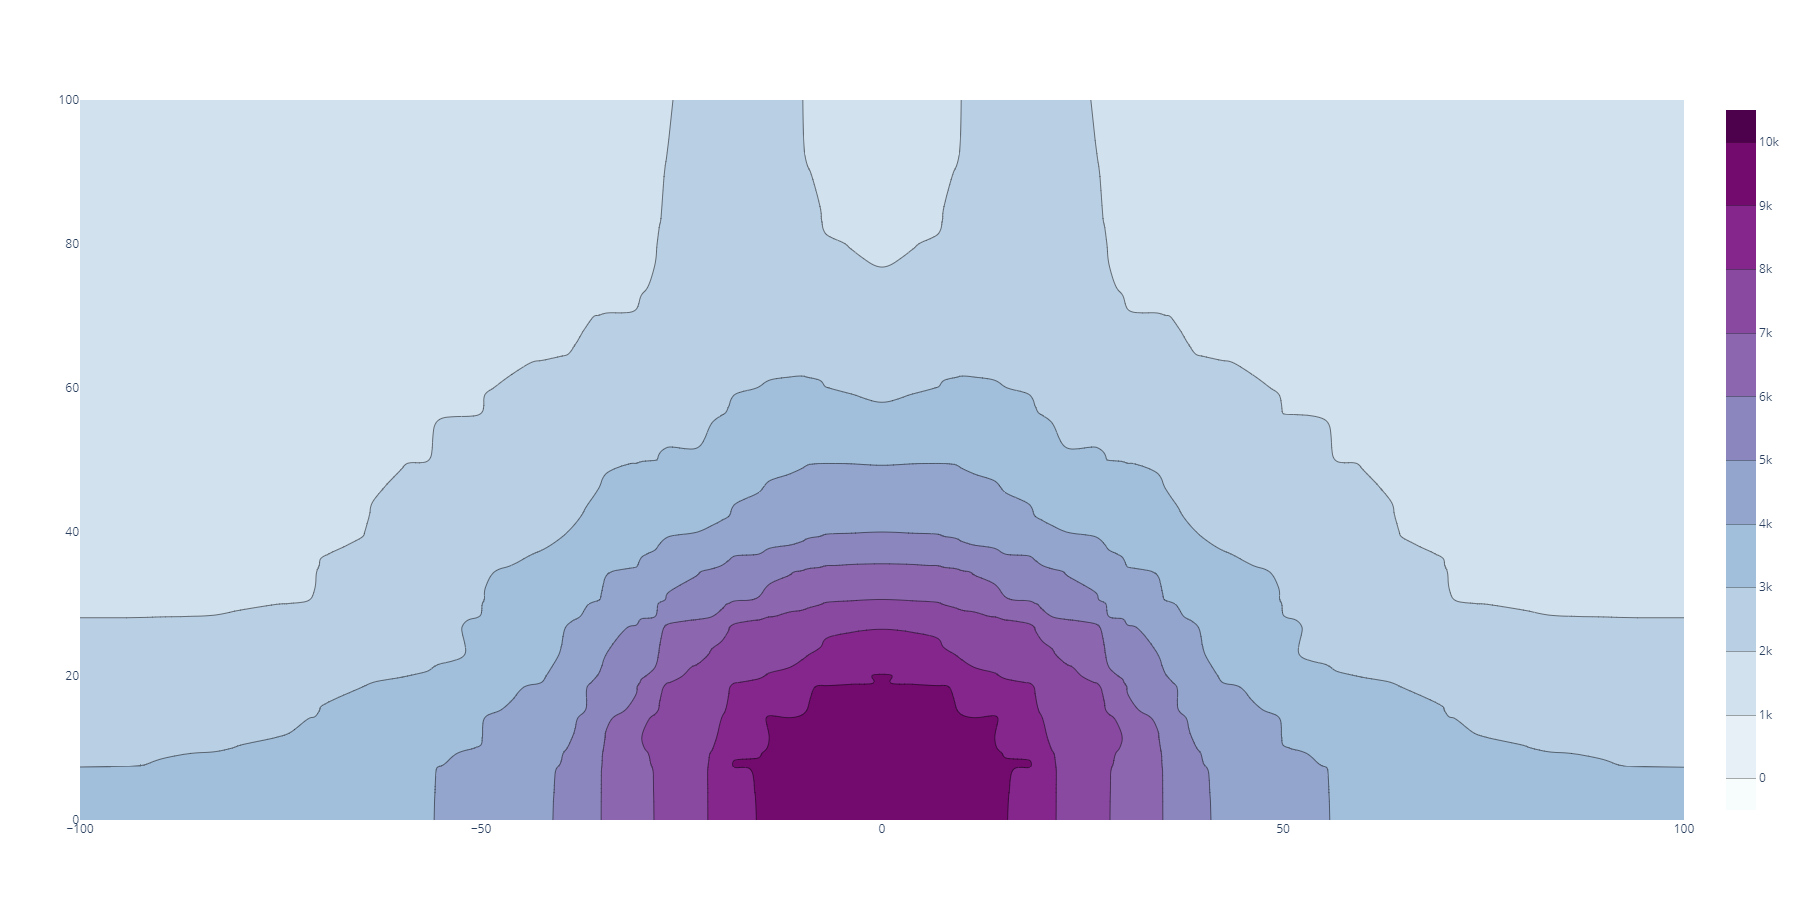
Above is the contour plot of the Aquarium Lamp. This bulb has significantly higher output than the toothbrush bulb. The X and Y axes are position distance in mm, intensity scale on right side is μW/cm^2. The Lamp is a cylinder so the output is even radially (I did not clean this up here in the 2D plot, but I did in the 3D CAD). There is approximately a 33.3% drop off in power between the mid plane Z-height of the bulb and the ends.